MALMIJAL - Modeling
No Reviews ยท 0 reviews
Screenshots


Description
Advanced signal processing and modeling software supporting FFT, STFT, PSD, FRF, filtering, and data analysis. Perform spectrum analysis, time-frequency analysis, coherence analysis, and vibration analysis for real-world signals from multiple data inputs and measurement systems.
Released
October 21, 2025
Price
Platforms
Windows
Developer
PANAX SYSTEM Co., Ltd.
Publisher
PANAX SYSTEM Co., Ltd.
About
MALMIJAL-Modeling is a versatile platform for analyzing and visualizing data through both drag-and-drop and modeling approaches.
It supports preprocessing, statistical analysis, filtering, and spectrum analysis, all performed through an intuitive workflow.
Results can be visualized as graphs or exported to files, and the software also includes the full feature set of MALMIJAL-Basic, allowing you to switch between modes with a simple toggle.
๐น Preprocessing
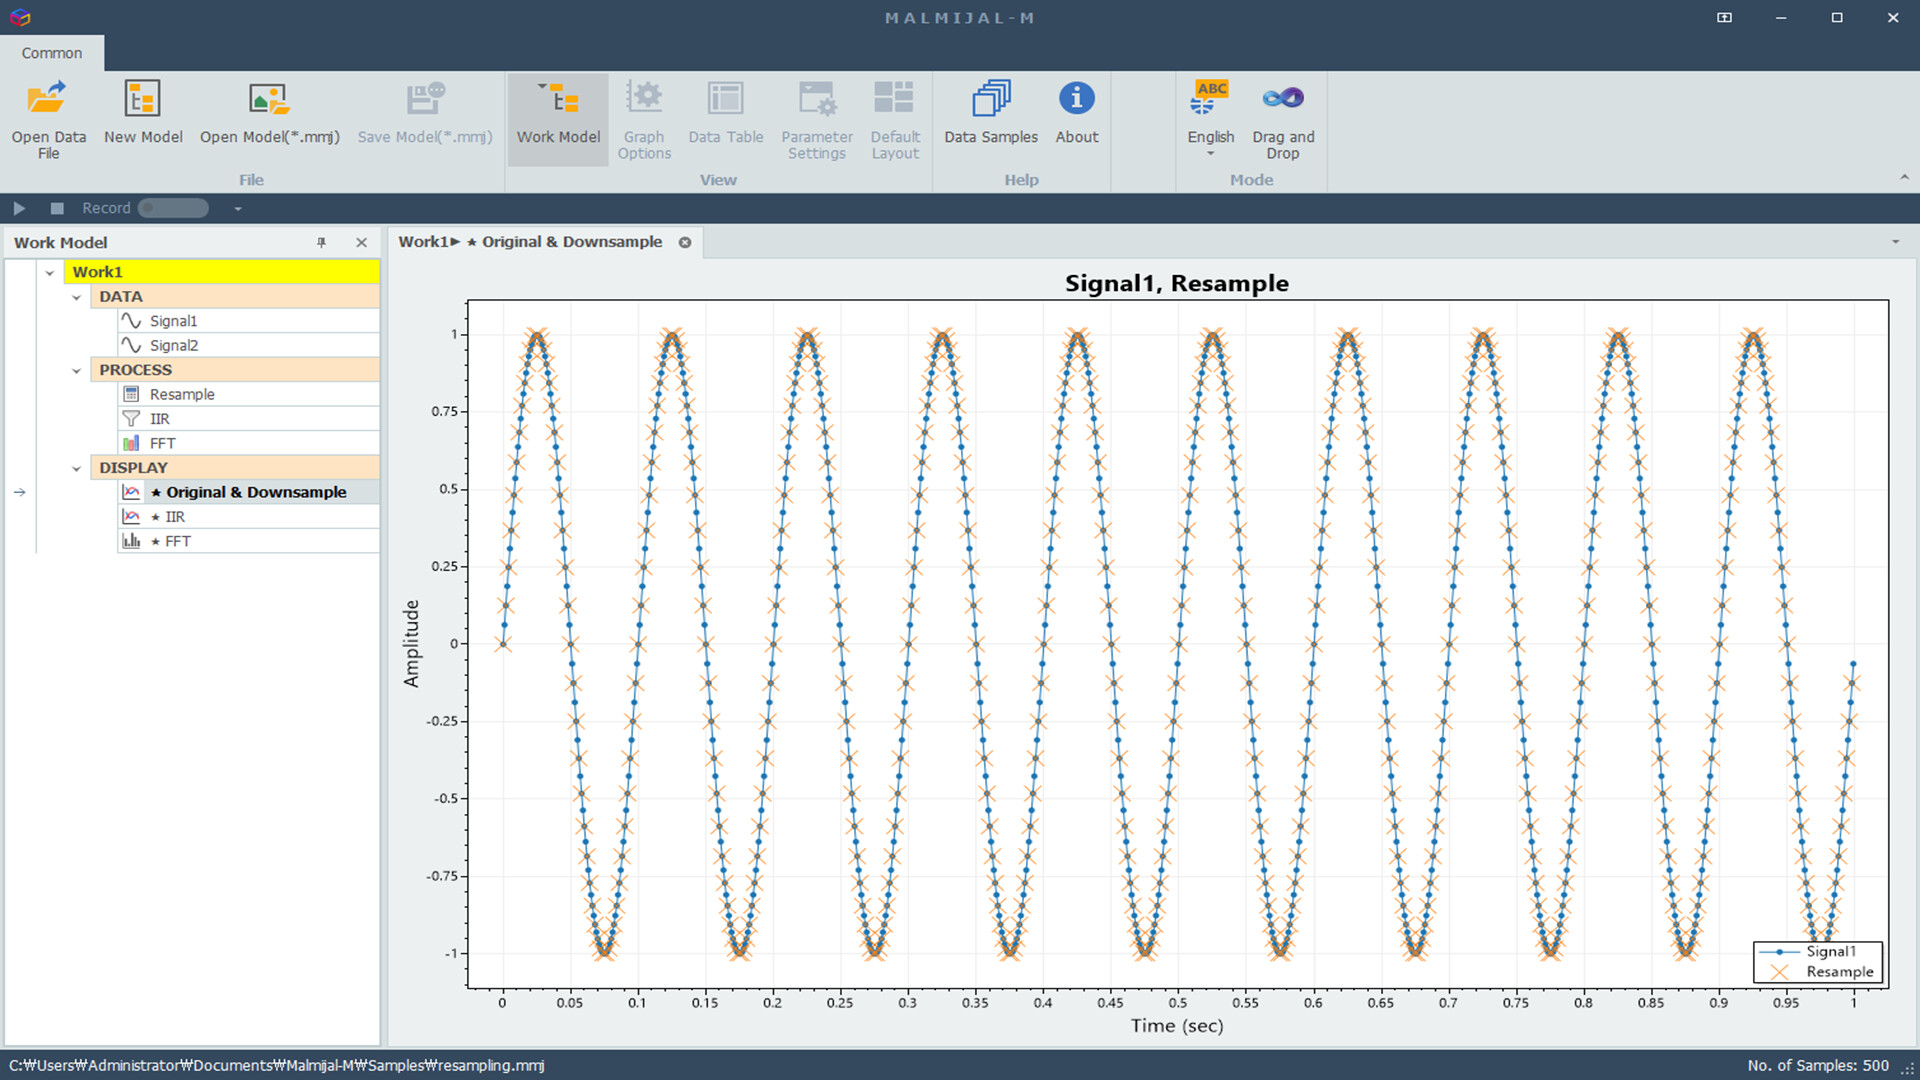
- Trend removal, resampling, curve fitting, arithmetic operations
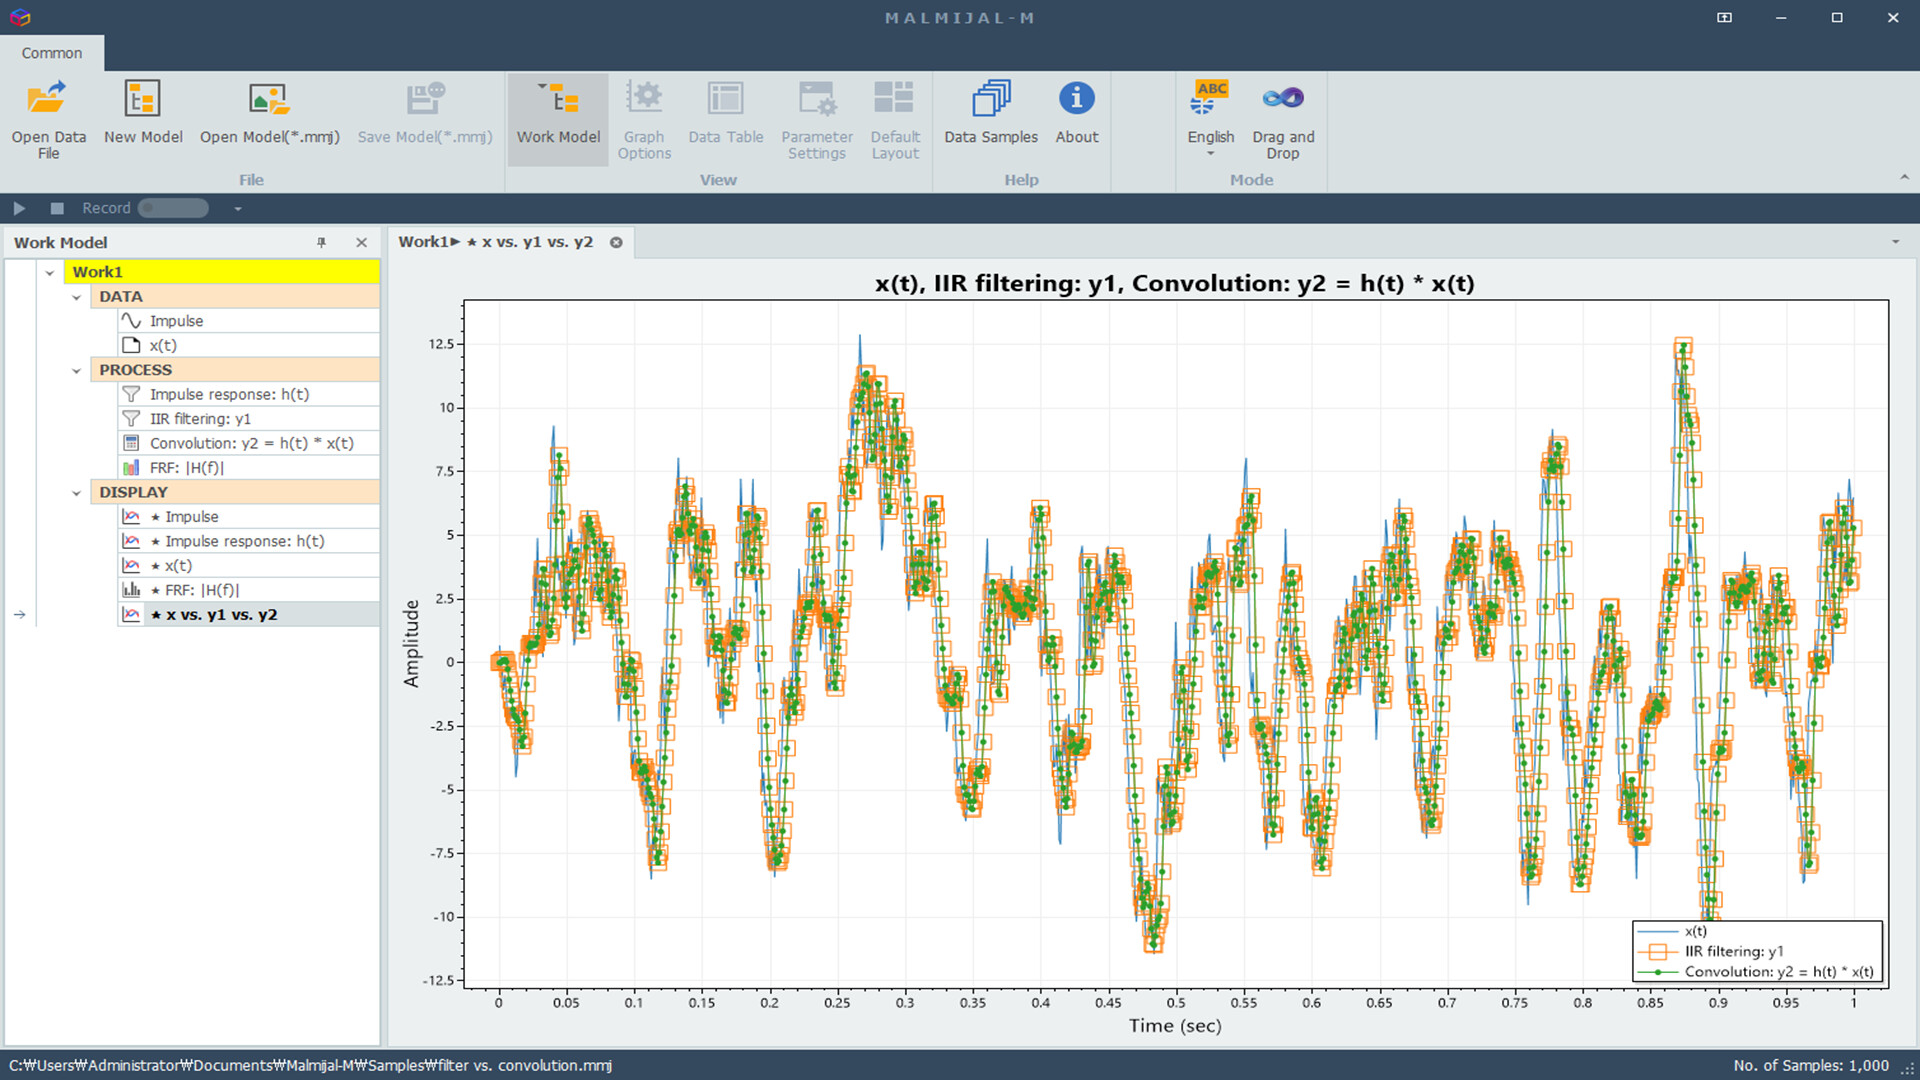
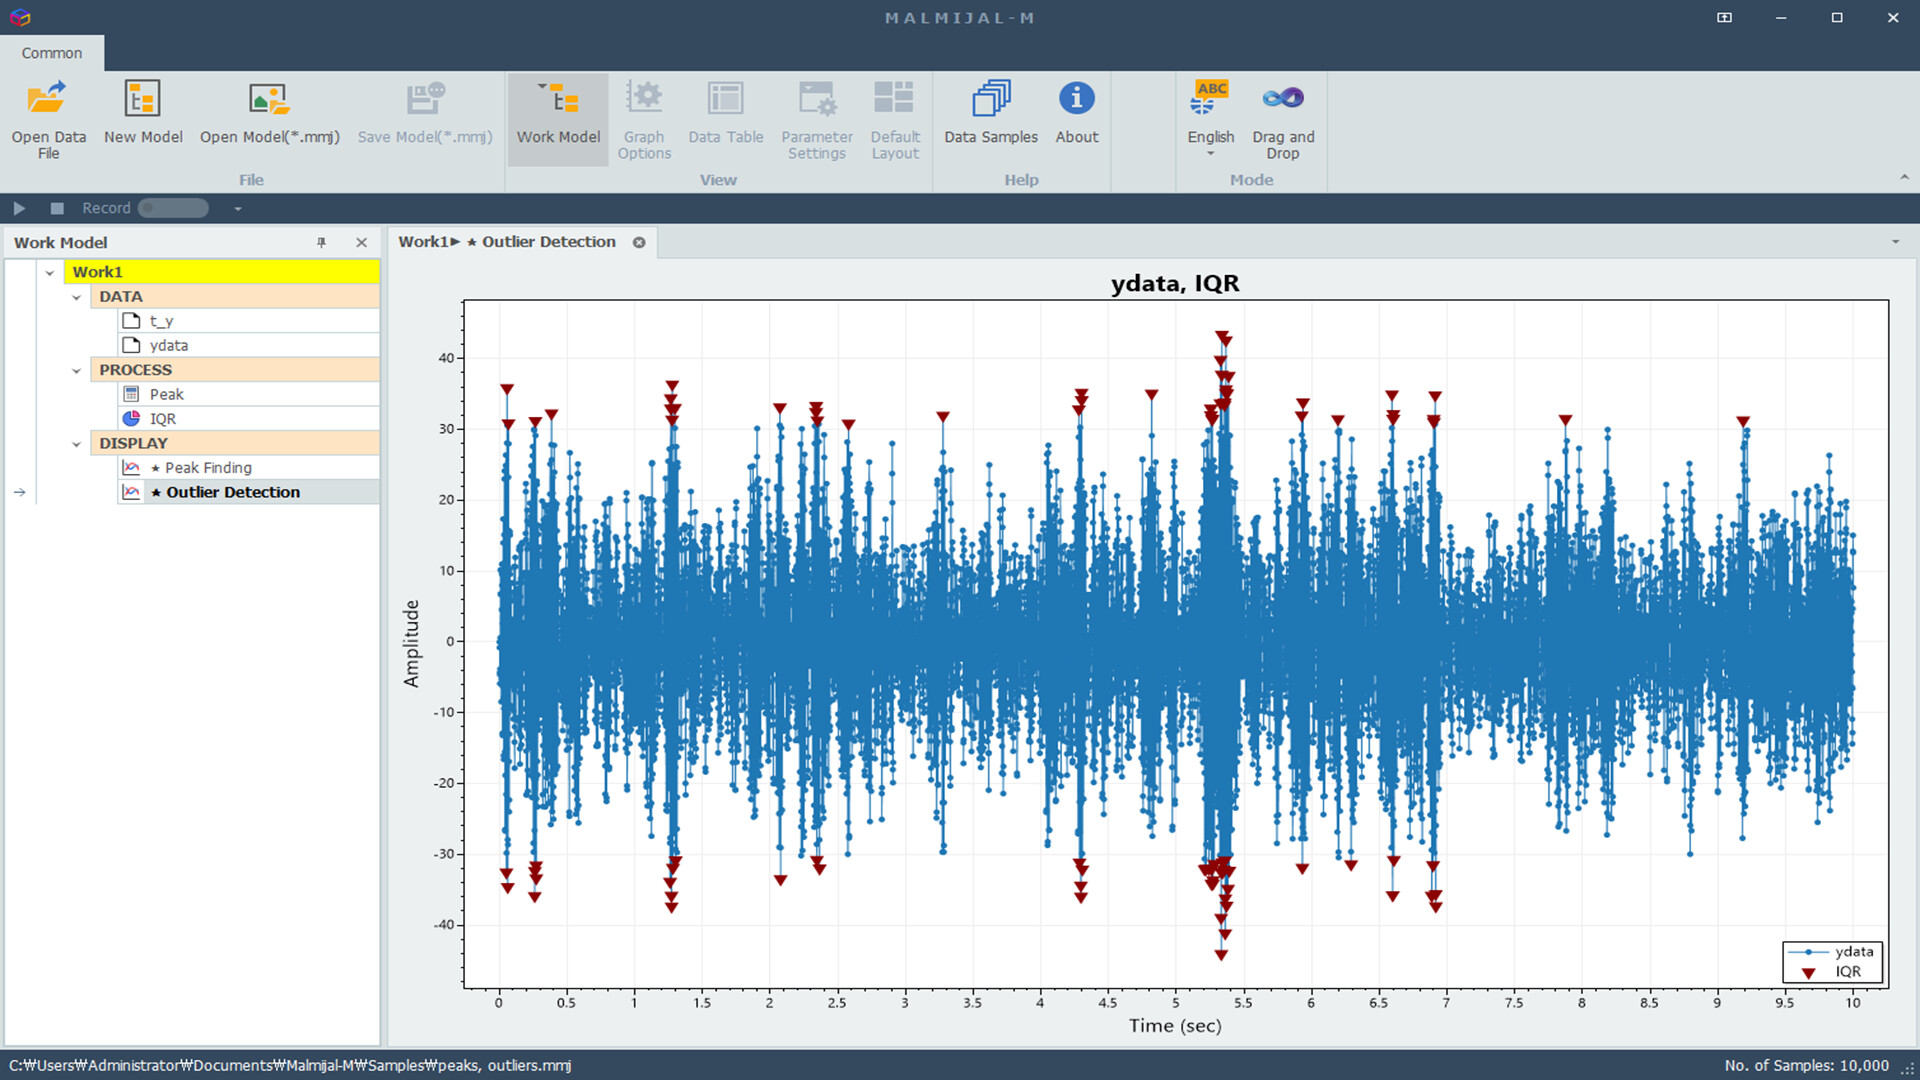
- Differentiation, integration, peak detection, convolution, envelope analysis
๐น Statistical Analysis
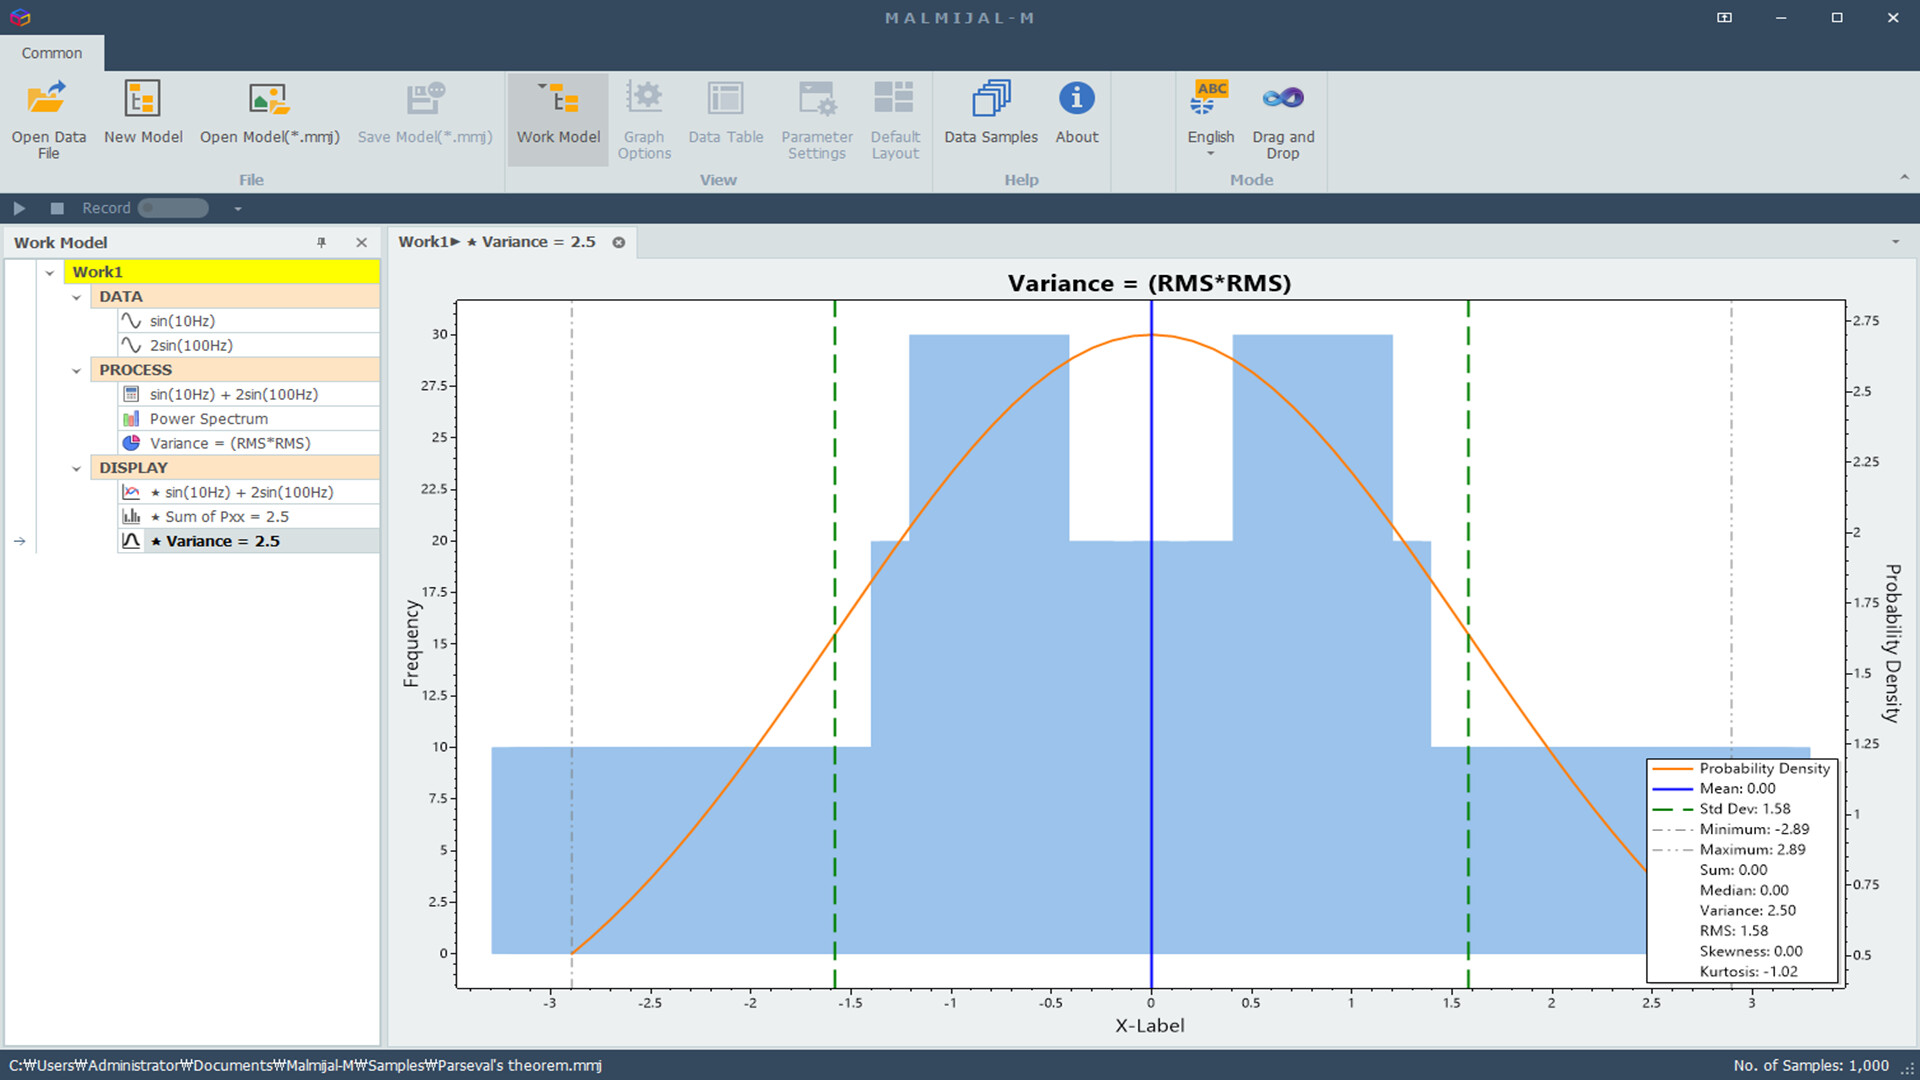
- Descriptive statistics including maximum, minimum, median, standard deviation, variance, RMS, skewness, and kurtosis
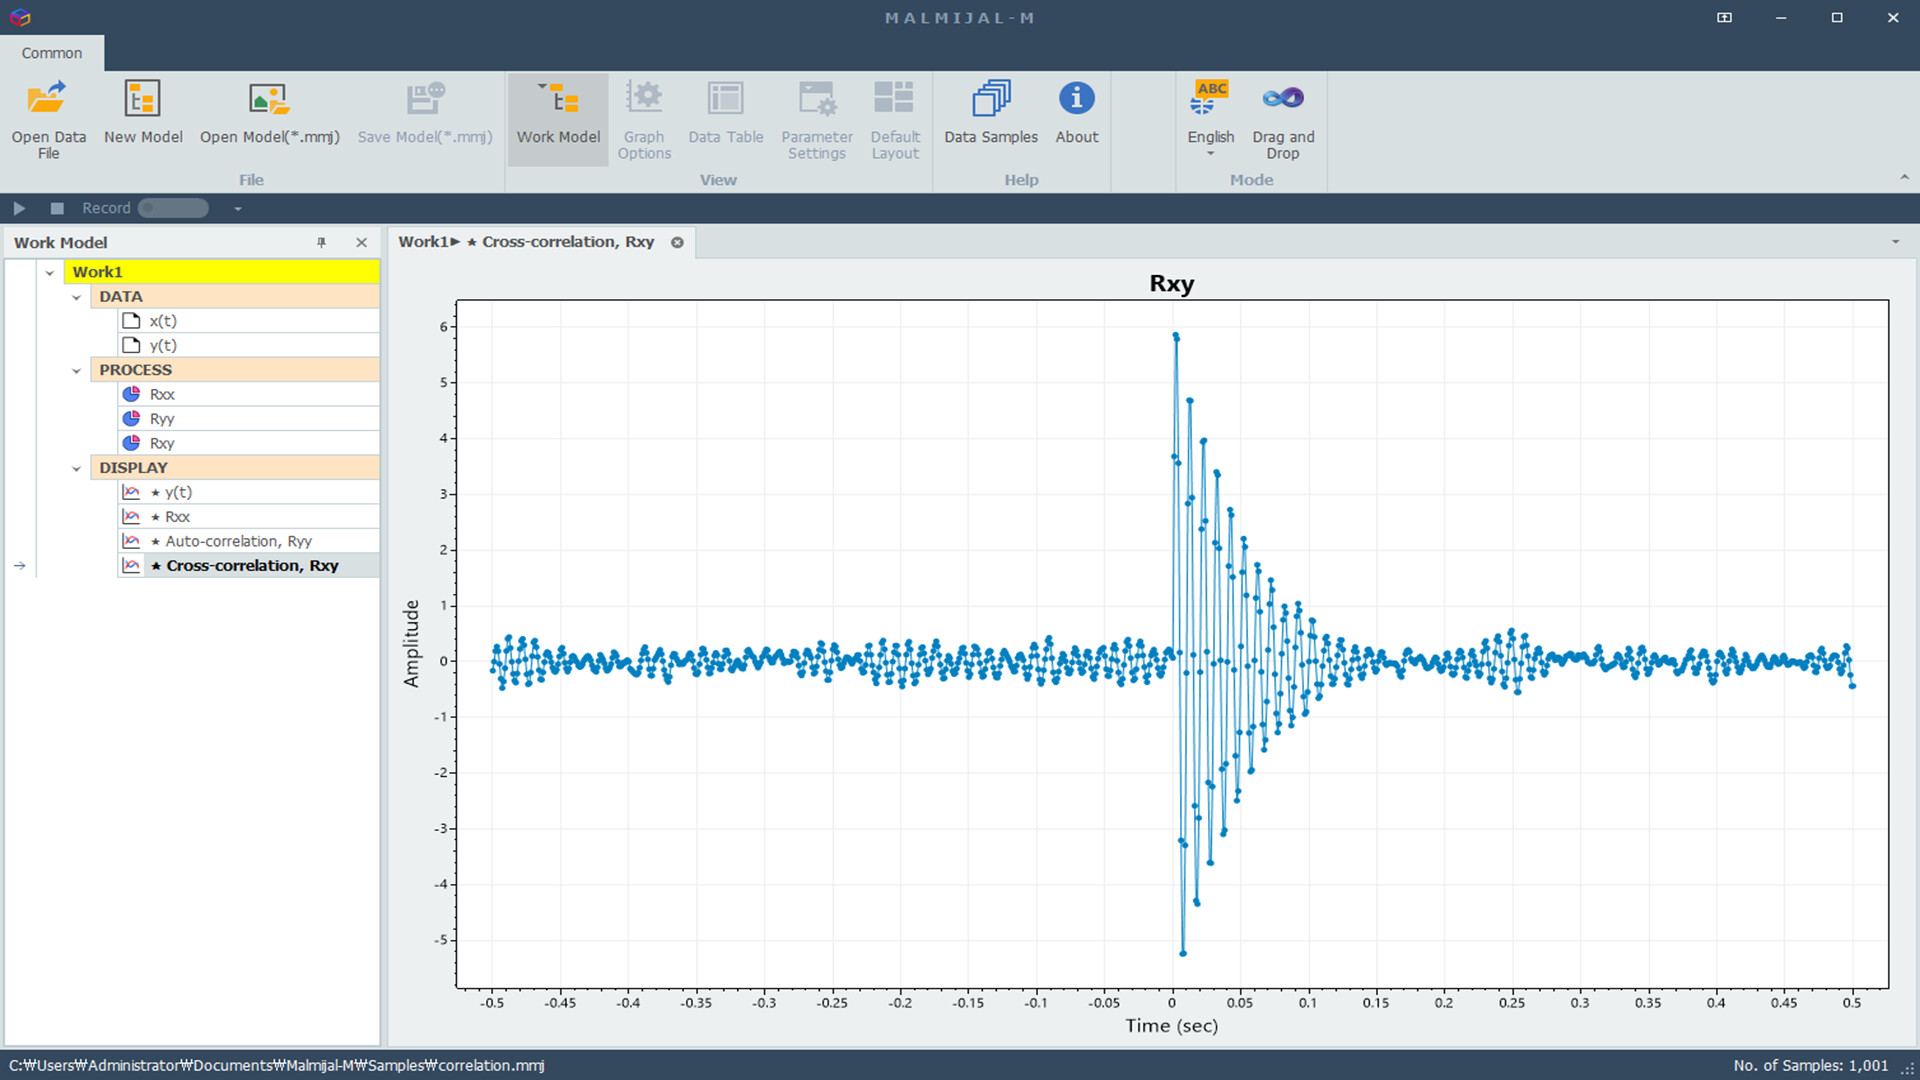
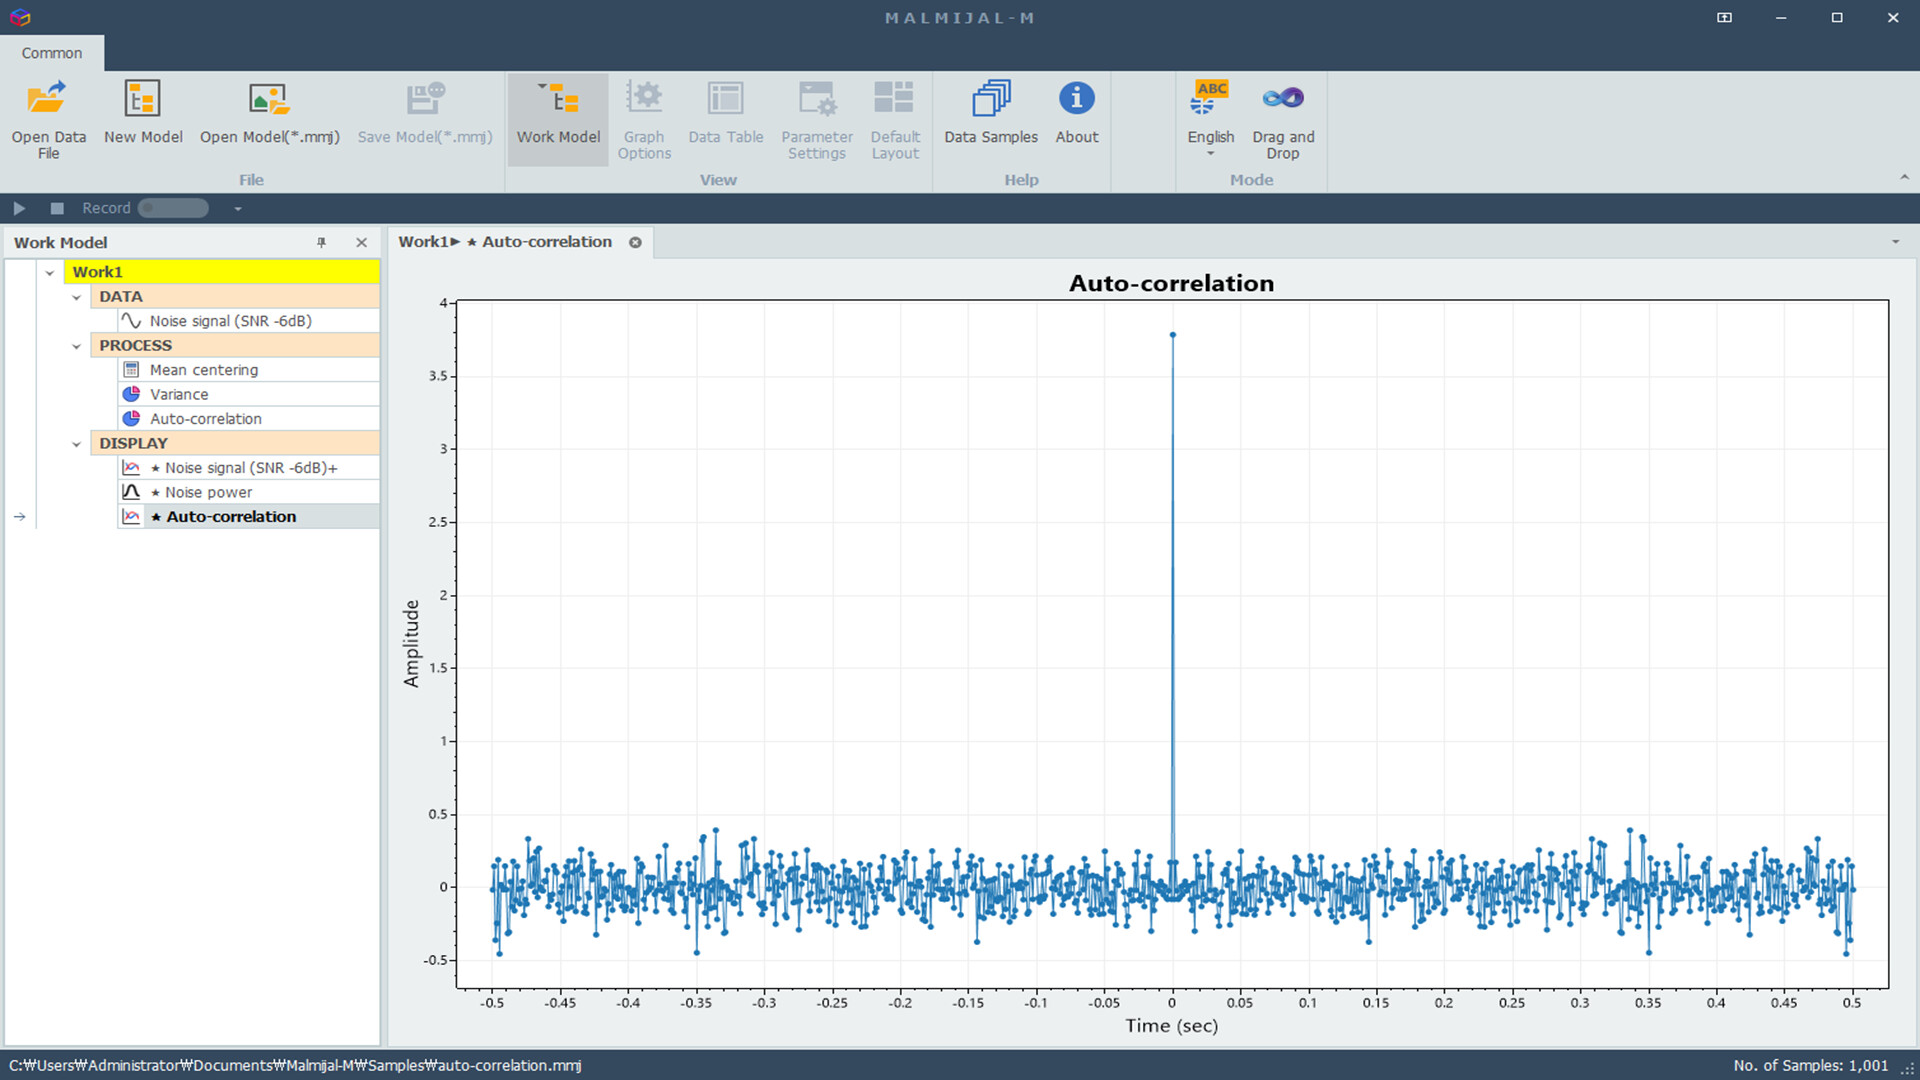
- Autocorrelation and cross-correlation (using two input signals in modeling mode)
๐น Filtering
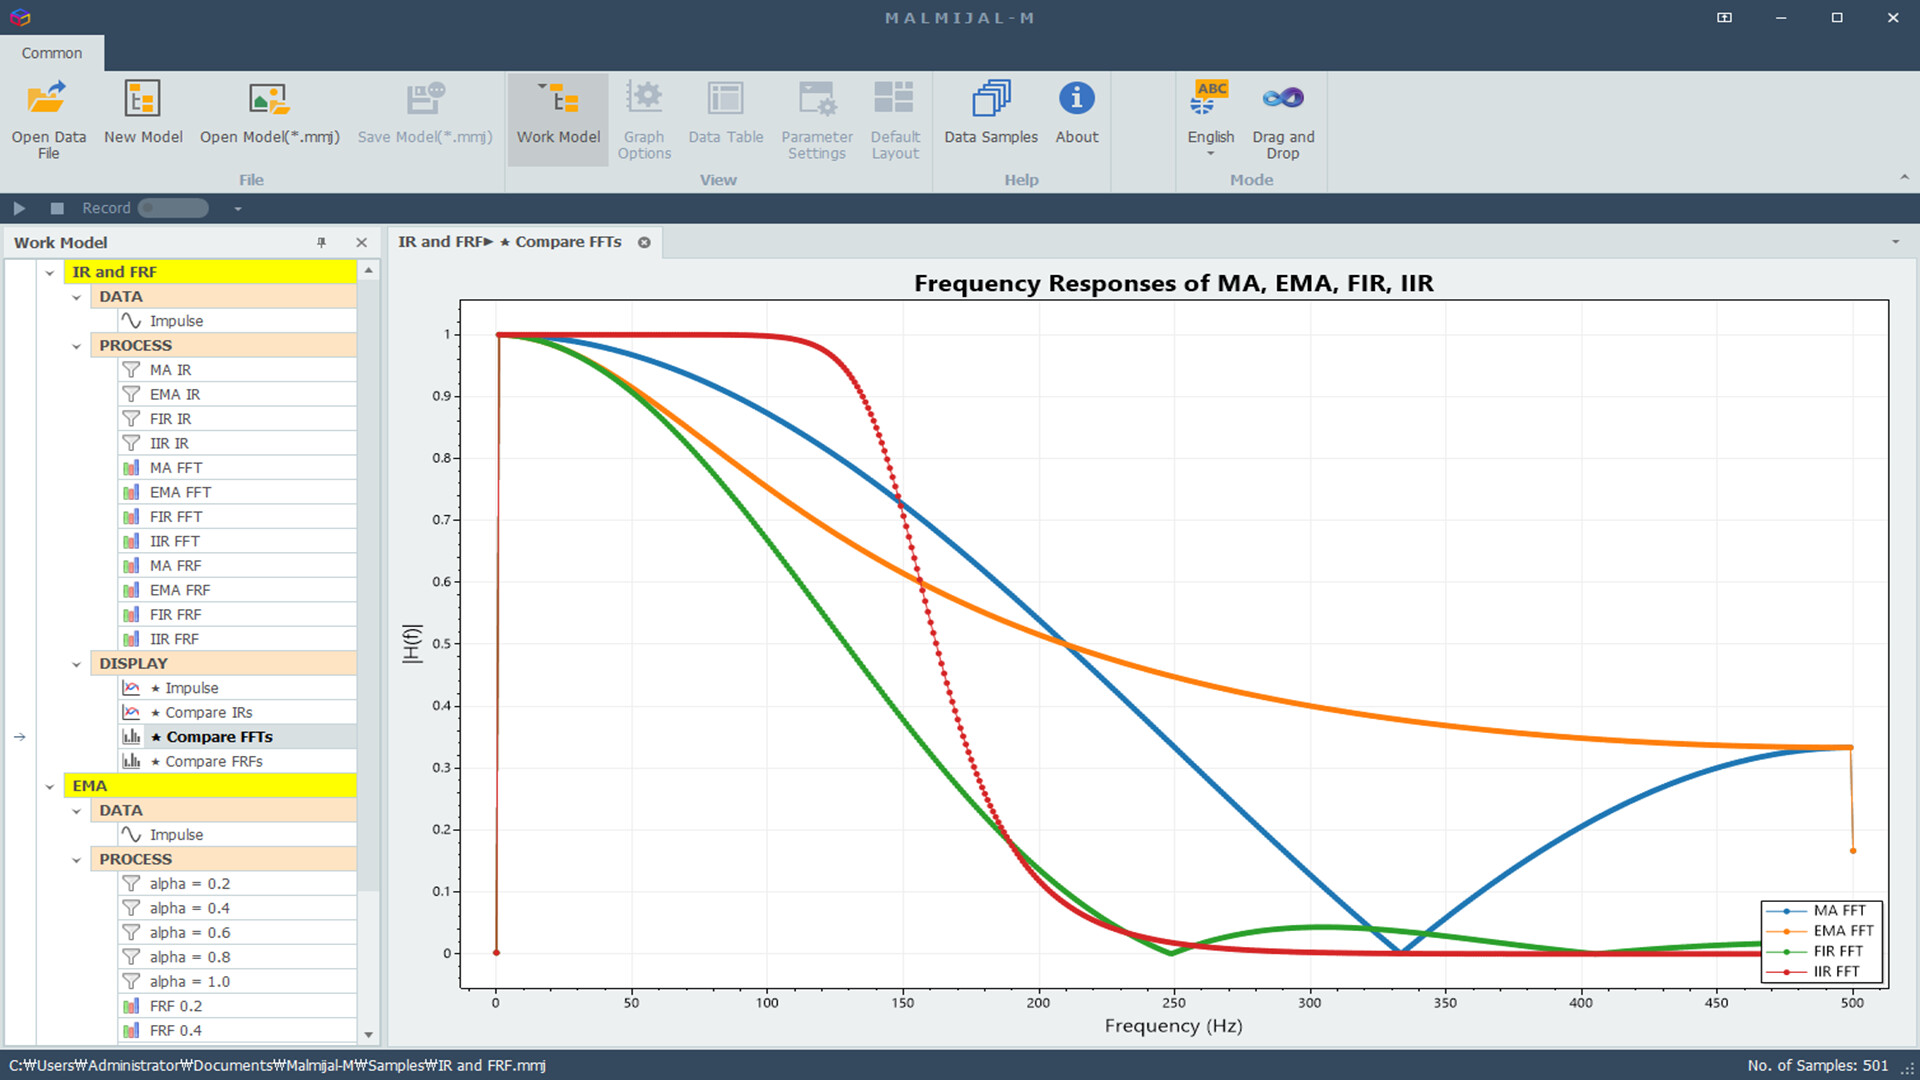
- Moving average, exponential moving average, FIR, and IIR filters
- IIR filters include Butterworth, Chebyshev I, Chebyshev II, and Elliptic
- Filter types: low-pass, high-pass, band-pass, and band-stop
- Image filtering also supported
๐น Spectrum Analysis
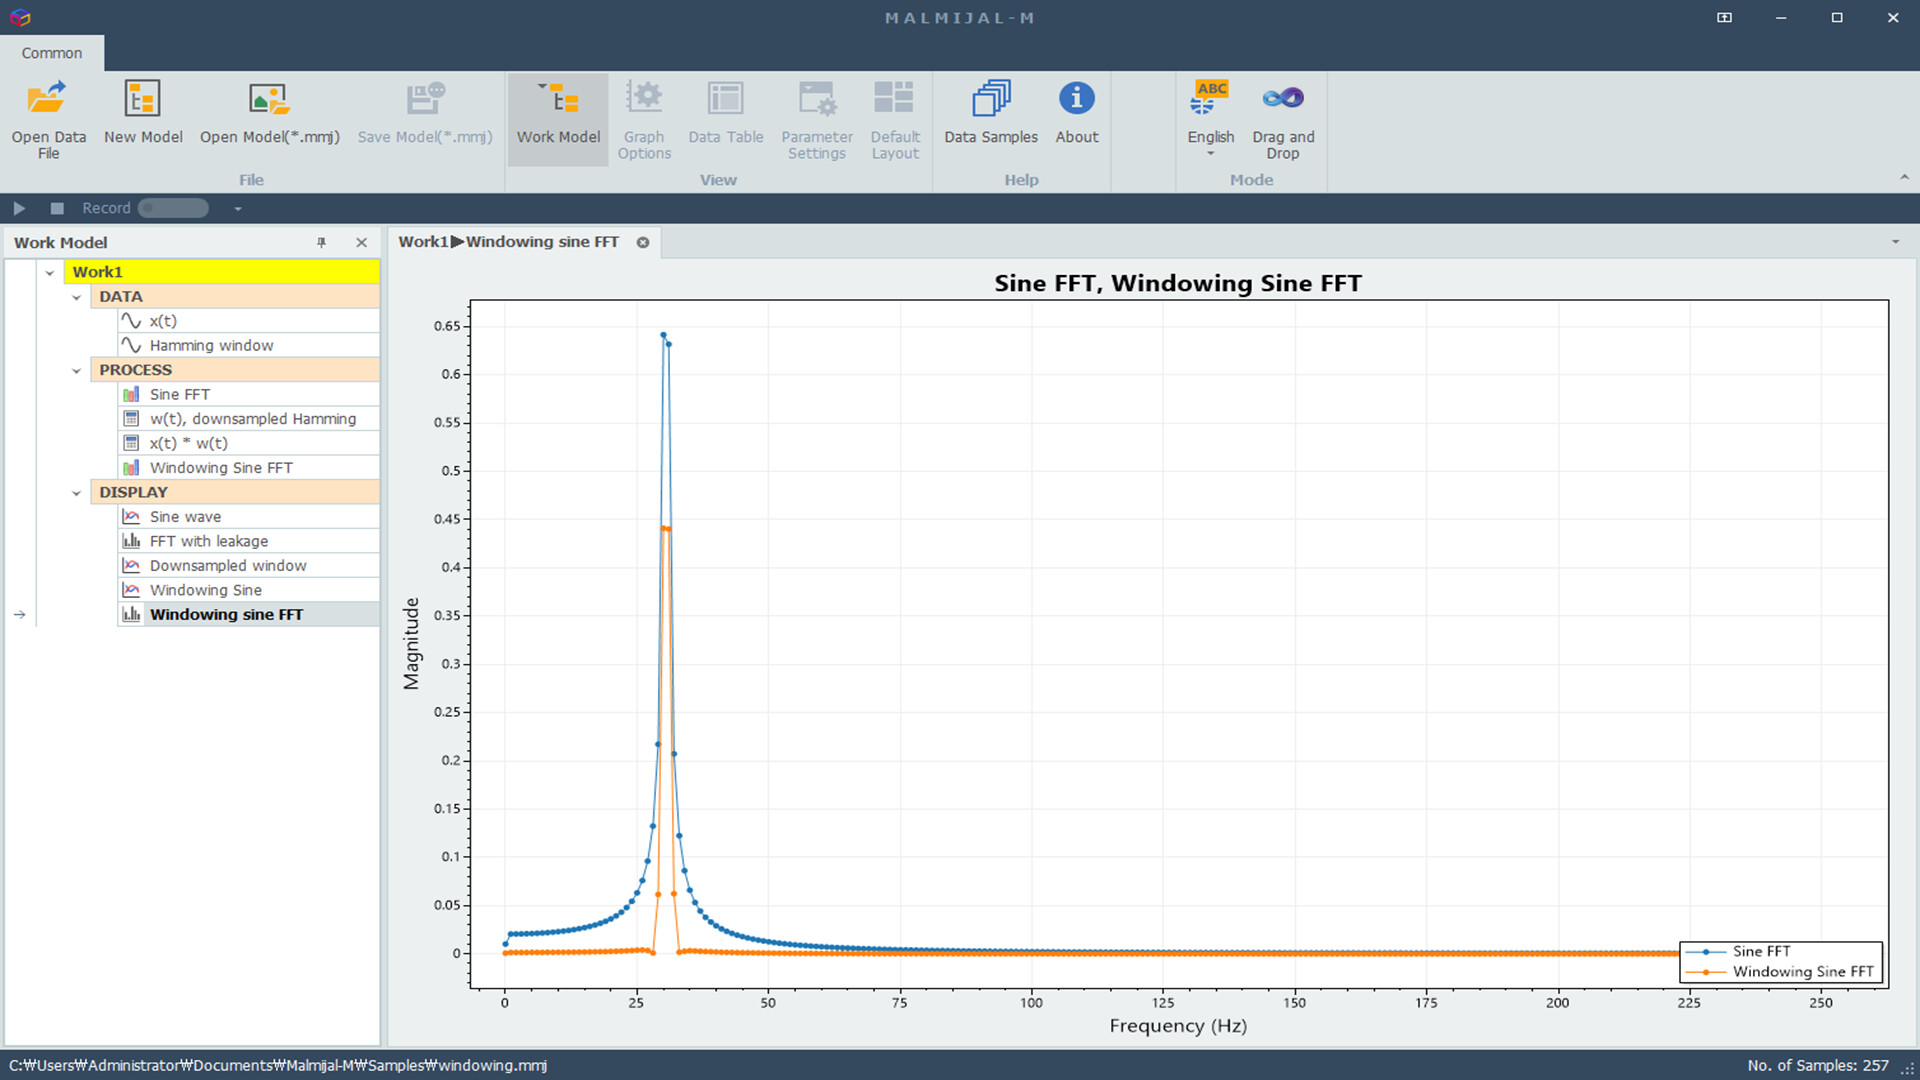
- FFT, PSD, CSD, power spectrum, cross power spectrum
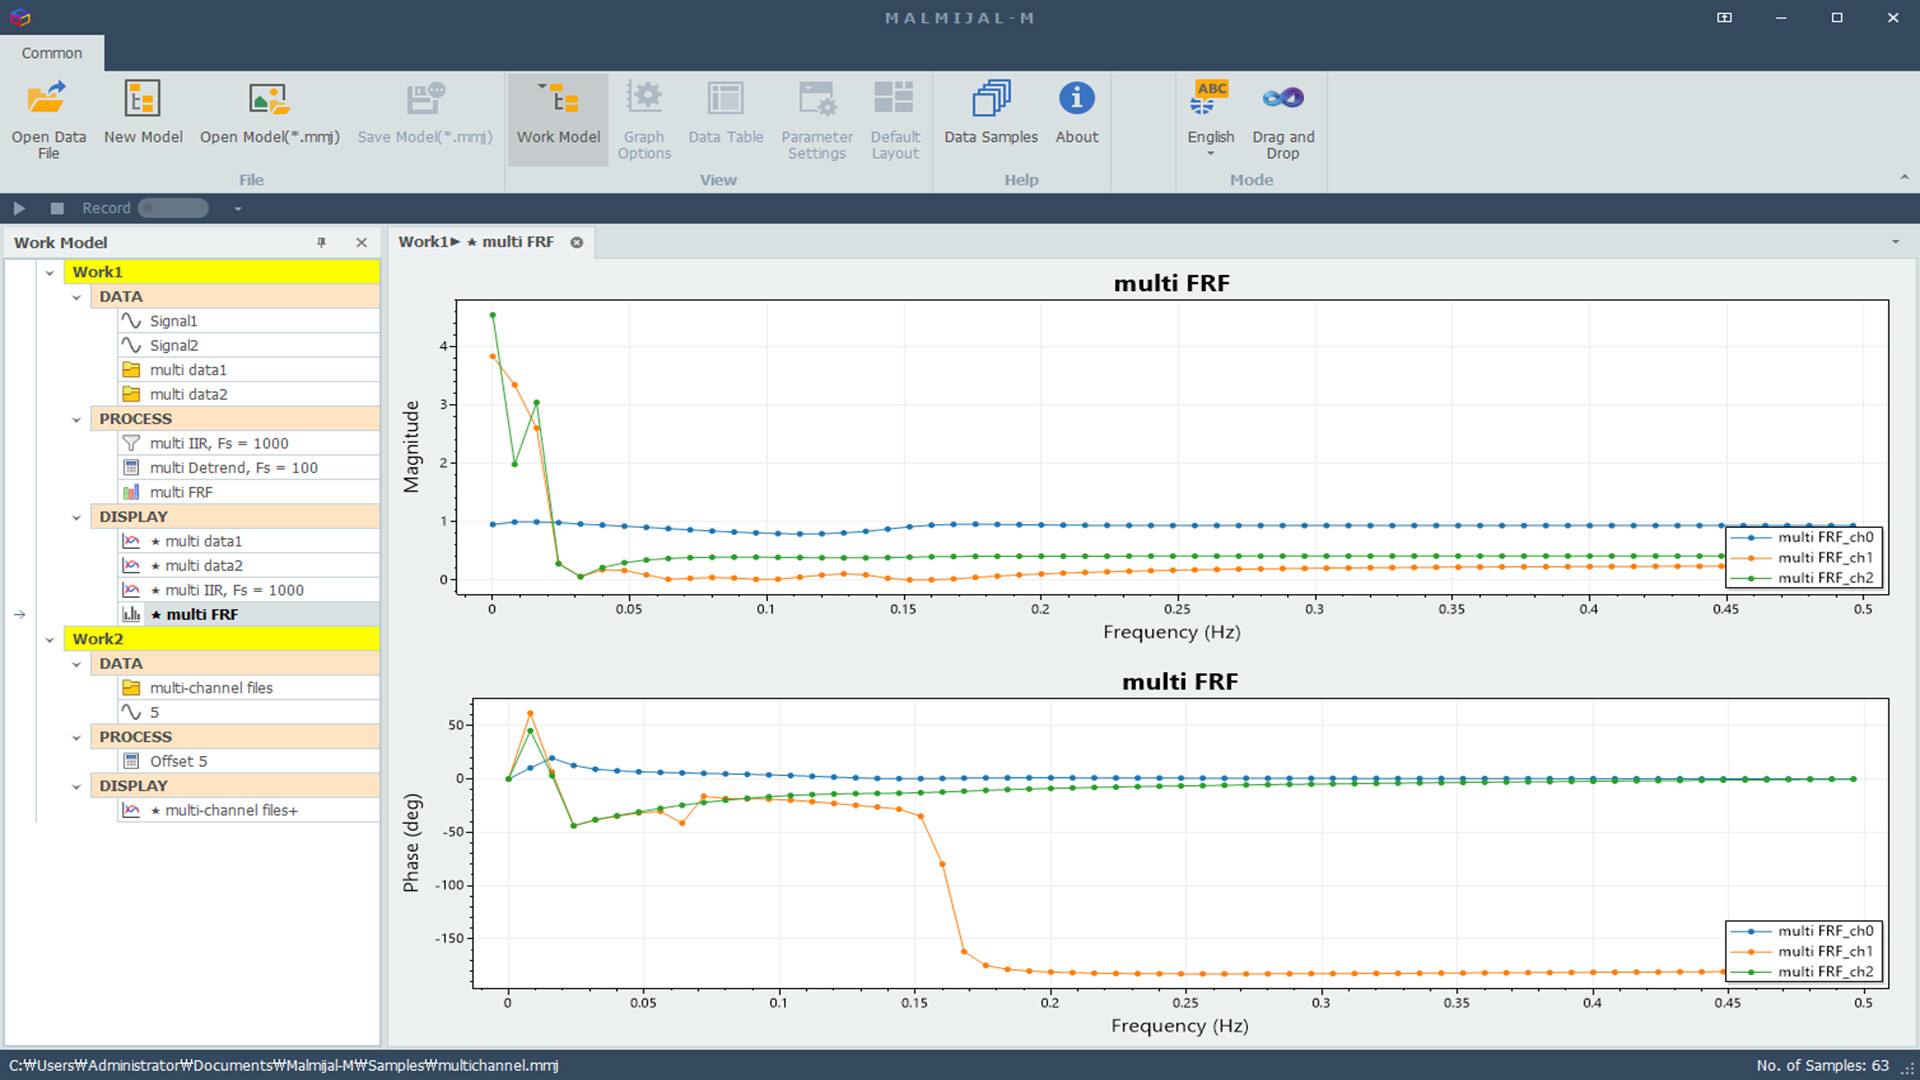
- Frequency response functions and coherence
- Modeling mode enables two-input data processing
- Supports overlap handling and multiple windowing methods
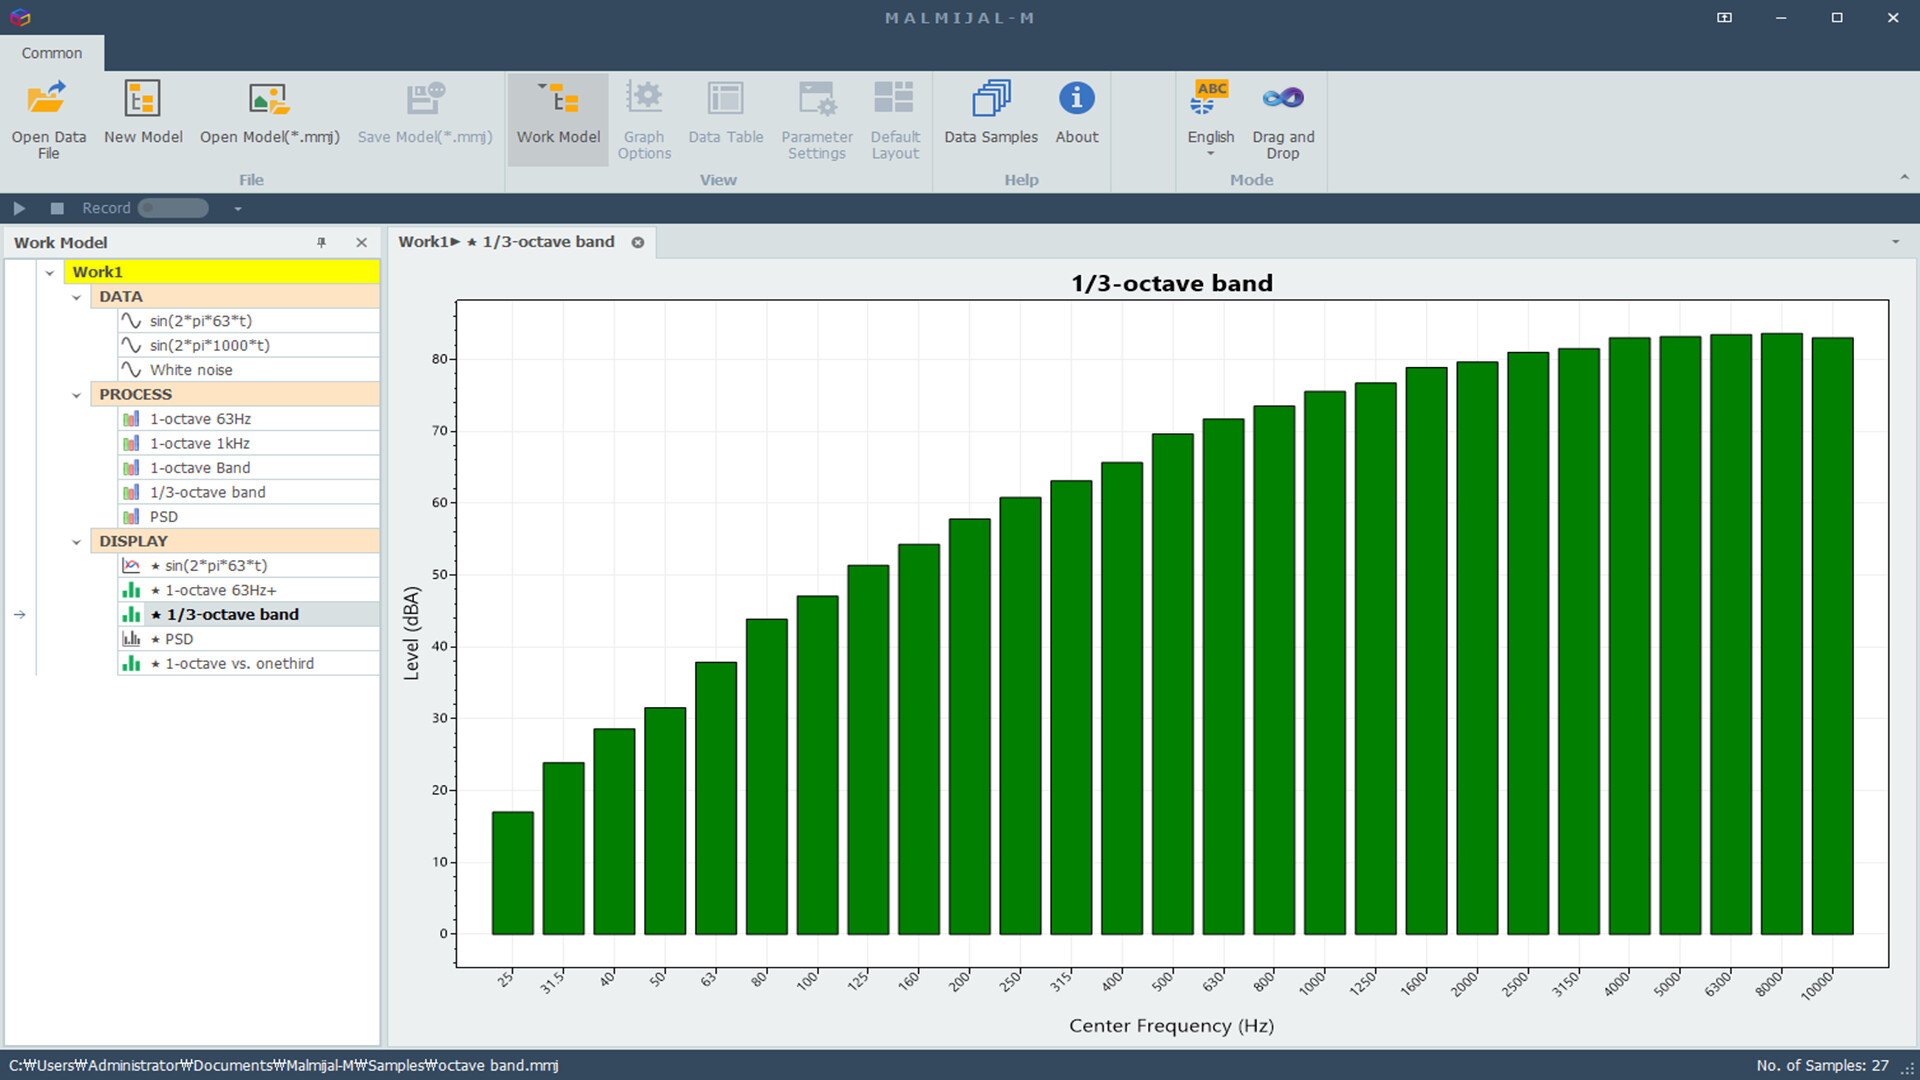
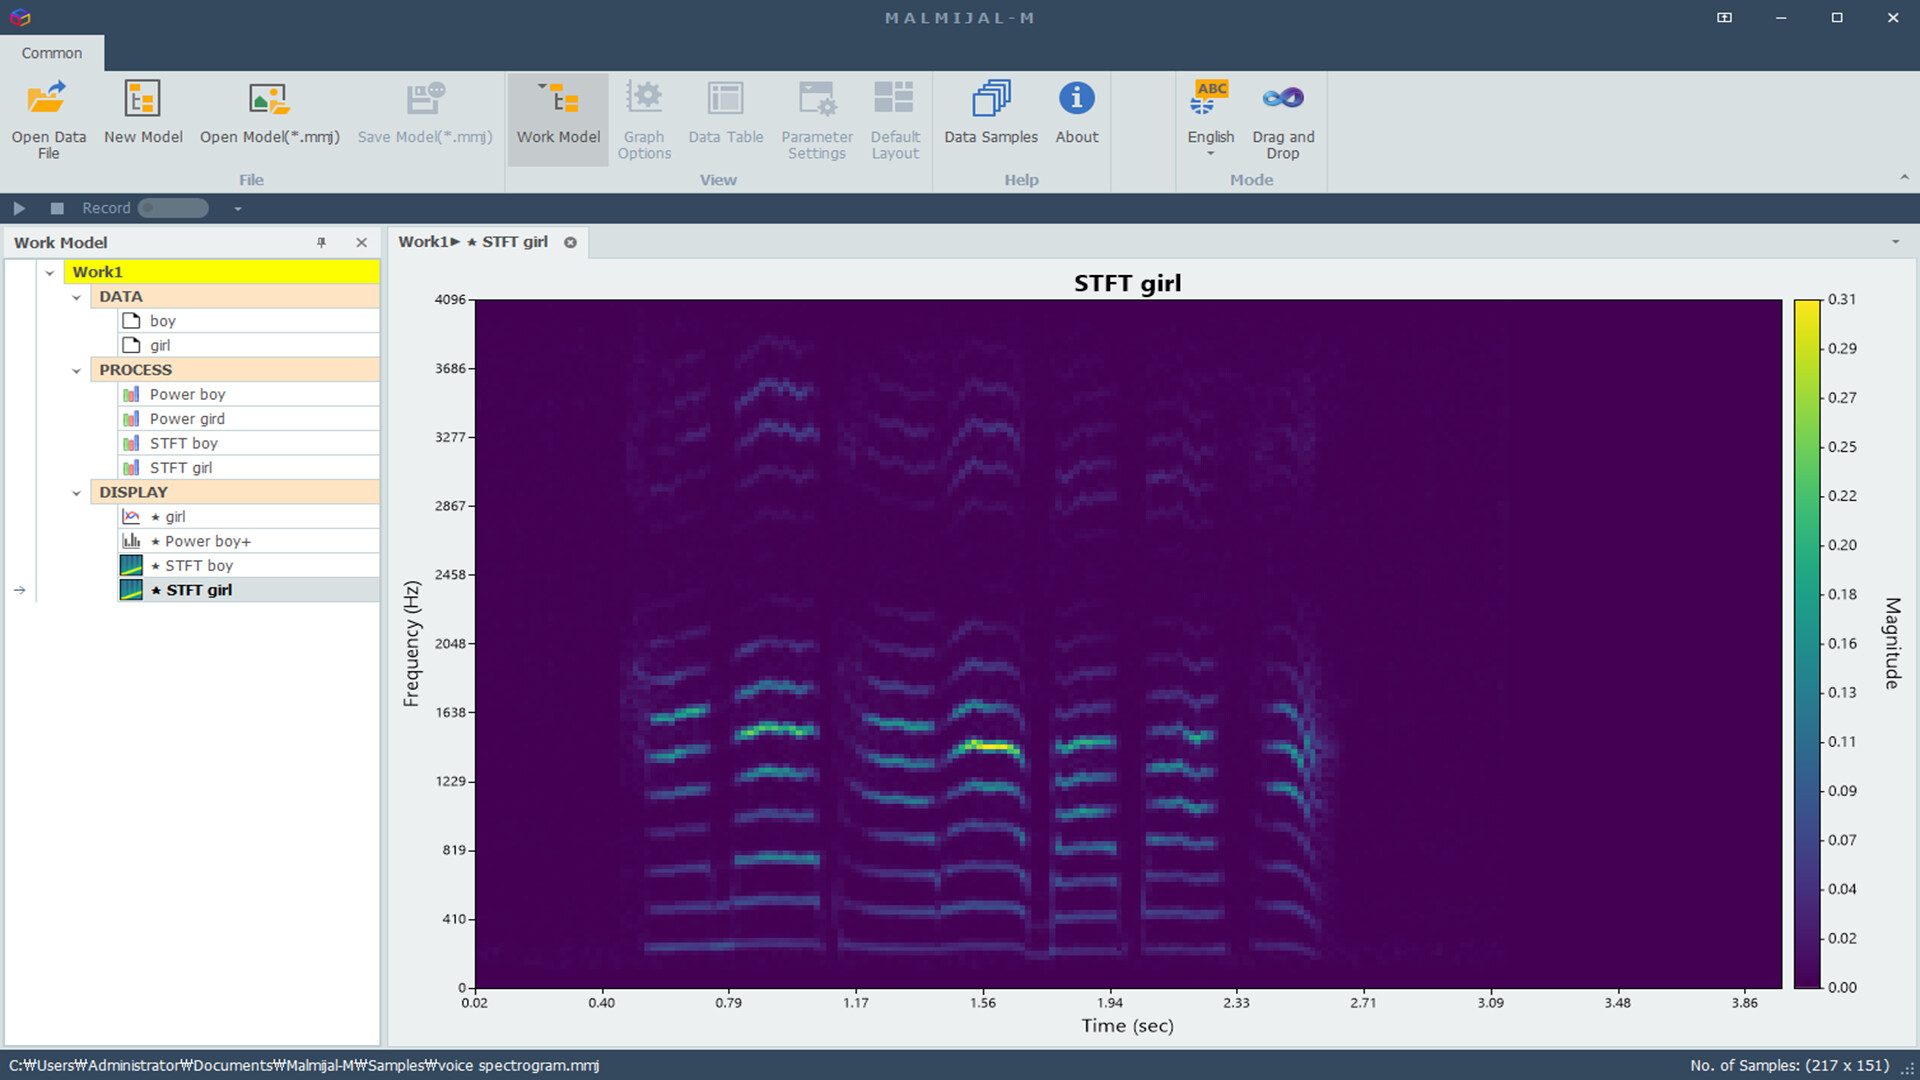
- Additional features: Short-Time Fourier Transform, 1-octave and 1/3-octave band analysis
๐น Data I/O and Visualization
- Supported formats: MATLAB binary (.mat), Excel (.xlsx), audio files (*.wav, *.flac, *.mp3, etc.), and text files
- Graphs: automatically rendered as bar, pie, or line charts depending on data type, with options for conversion
- Customization: marker shape and size, line style, color, thickness, and interactive data cursors
- In modeling mode, visualization settings can be saved to a model file (*.mmj) for reuse
๐น Example Use Case
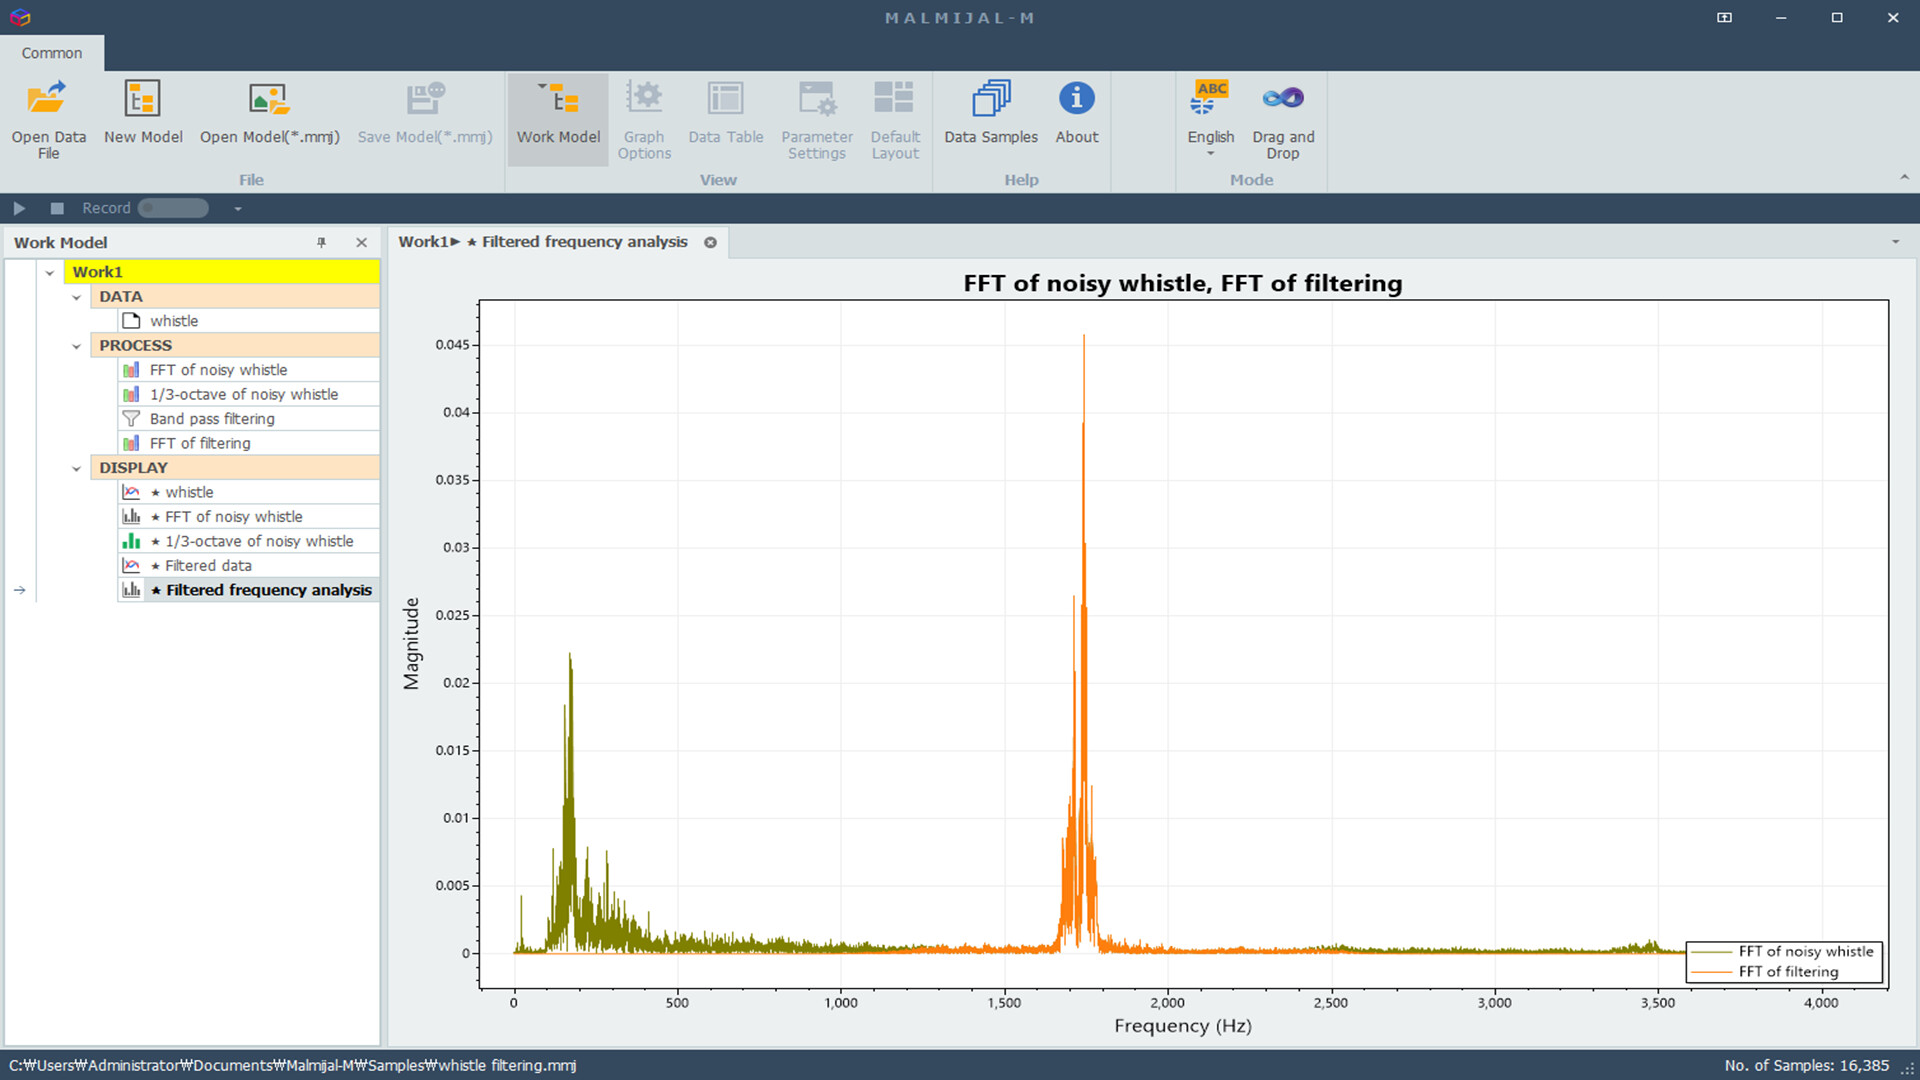
Record a whistling sound with background noise, apply filtering to remove the noise, then analyze the frequency spectrum and play back the cleaned signal.
With MALMIJAL, these processes can be executed quickly without programming knowledge, making it accessible even to non-experts.
Teams can discuss which filter to use, set parameters, and immediately run the analysis. Results can be exported as graphs or text files for reporting and further study.
๐น Modeling Features
- Includes dozens of example model files (*.mmj)
- Loading a model file executes processes sequentially, similar to a macro
- Users can simply replace input data or adjust parameters to quickly perform new analyses with the same workflow